
Projection Histogram of image using Python and Opencv
Hi fellows, what’s going on ? Today, in this post, I’ll show what is projection histogram of image and how to plot this projection histogram.

We can use projections to extract features onto an image, for example, if we want to recognize some characters. The projection histogram is the method that uses the image projection in a established direction, for example, in a vertical or horizontal direction. These projections mean a number of pixels belonging to objects in each column or each row, and it is a good idea because we can represent an image by reducing the number of descriptive information. The image below represents the number 5 and the vertical and horizontal projections respectively.
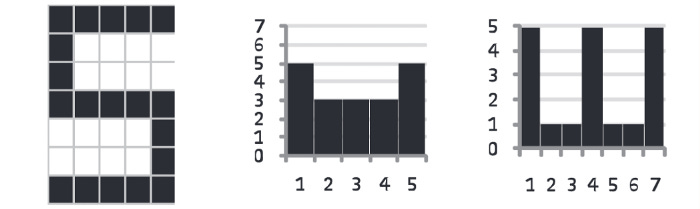
Note: each segment of the histogram can be used as descriptor vector attributes. We can use the descriptor that represents each digit, by simply comparing it with vectors that represent the digits 0 to 9, previously stored in a base in order to verify each number. For example by using a similarity measure.
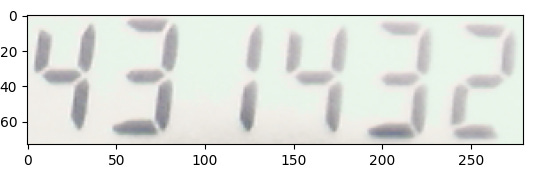
But, how can we build this projection histogram? In this post I’ll show you how to represent a vertical projection of a display image example. Let’s go!
In the first part of our code, we’re going to follow classical steps. Such as:
1.Read an image
2.Change to grayscale representation
3.Smooth this image using median filter
4.Apply adaptive threshold resulting in a binary image
5.Apply some dilation and erosion to try to join the gaps
Part of this code is as follows:
import cv2
import numpy as np
import matplotlib.pyplot as plt
import os
# Load the image
img = cv2.imread('display_image.png')
# convert to grayscale
gray = cv2.cvtColor(img,cv2.COLOR_BGR2GRAY)
# smooth the image to avoid noises
gray = cv2.medianBlur(gray,5)
# Apply adaptive threshold
thresh = cv2.adaptiveThreshold(gray, 255, 1, 1, 11, 2)
thresh_color = cv2.cvtColor(thresh, cv2.COLOR_GRAY2BGR)
# apply some dilation and erosion to join the gaps
kernel = np.ones((5,5), np.uint8)
thresh = cv2.dilate(thresh, kernel ,iterations = 2)
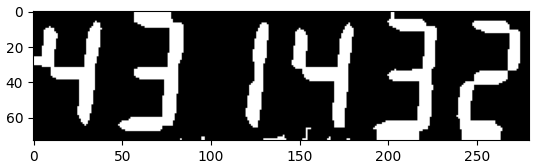
thresh = cv2.erode(thresh, kernel, iterations = 2)And the result of these steps is these images bellow:
Now, the next steps are to find the contours and for each contour find the bounding rectangle and draw it in this image.
# Find the contours
contours,hierarchy = cv2.findContours(thresh, cv2.RETR_LIST, cv2.CHAIN_APPROX_SIMPLE)# For each contour, find the bounding rectangle and draw it
for cnt in contours:
    x,y,w,h = cv2.boundingRect(cnt)
    if h > 10:
        cv2.rectangle(img,(x,y),(x+w,y+h),(0,255,0),2)
By doing this we can make the projection histogram.
# Width and heigth the image
height, width = thresh.shape# Sum the value lines
vertical_px = np.sum(thresh, axis=0)
# Normalize
normalize = vertical_px/255
# create a black image with zeros
blankImage = np.zeros_like(thresh)# Make the vertical projection histogram
for idx, value in enumerate(normalize):
    cv2.line(blankImage, (idx, 0), (idx, height-int(value)), (255,255,255), 1)# Concatenate the image
img_concate = cv2.vconcat(
    [img,  cv2.cvtColor(blankImage, cv2.COLOR_BGR2RGB)])plt.imshow(img_concate)
plt.show()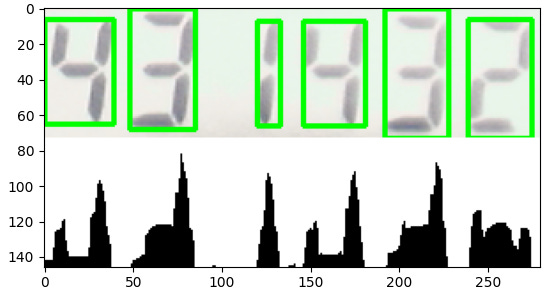
Note that the repeated numbers like 4 and 3, and the vertical projection histogram respectively, are almost the same!!
So, this is a simple post that I try to show how to make projection histogram easily and how to plot it. As I said, you can build a stored vector for each character and use it to classify them.
See you in the next chapter.
Thanks to all !